

By now we could make a running server faster. That left two pauses the throughput charts did not explain: waiting for a model to start, and waiting for a long conversation to be read again after its cache had been evicted. We used the node’s host RAM and NVMe drives to investigate both. The useful result was knowing which work we could avoid, and which supposedly configured memory tier we had never actually exercised.
We had two different kinds of waiting
A serving process can be fast once it is ready and still be awkward to operate. A model swap, restart or scale-out event pays startup costs before the first useful token. A busy chat service faces a different delay: if prior conversation state no longer fits in the GPU cache, a later turn may have to recompute prompt state that was useful a moment earlier. We kept these as separate experiments rather than calling both “offload.”
This node has a lot of "somewhere cheaper": 141 GB of HBM per GPU, then 2 TB of host RAM across two sockets, then a 12 TB NVMe RAID0 (13.5 GB/s sequential read in the fio run from Part 1). The plan was a ladder down all three. What we actually measured is less tidy, and this post says exactly where each rung stopped.
Everything here ran on one GPU (GPU 4) with Qwen3.8-27B FP8, except one GLM-5.3-Flash run on four GPUs. All are our own measurements on vLLM 0.31.0 unless a link says otherwise.
| Tier on this node | What we tried | Result |
|---|---|---|
| HBM (141 GB per GPU) | Baseline: prefix caching on, nothing below it | Measured. 2,915,222 KV tokens on one GPU; 32 long sessions don't fit (1.3×), so every turn re-reads its whole prompt |
| Host RAM (2 TB, 2 sockets) | vLLM native CPU offload, 200 GiB | Measured, clear win. 97.7% of prompt tokens came back from RAM; later-turn TTFT fell about 4× |
| Host RAM via LMCache | LMCache 0.5.6rc3: v1 connector, then multi-process server | No gain. First two launches crashed (hybrid KV); the MP server ran but got 0% hits, cause not found |
| Host RAM, larger model | gpt-oss-120b, simple CPU offload, 4 replicas | Not run. 4 × 400 GB pinned buffers: host out of memory |
| NVMe RAID0 (12 TB) | GLM-5.3-Flash with a RAM + file-system tier | Not measured. The KV fit in HBM, so the tier was never read (0% external hits) |
| Process snapshot | vllm snapshot, raw CRIU + cuda-checkpoint | Blocked. Both need a CRIU CUDA plugin this node doesn't have |
Startup: time the first answer, then explain the wait
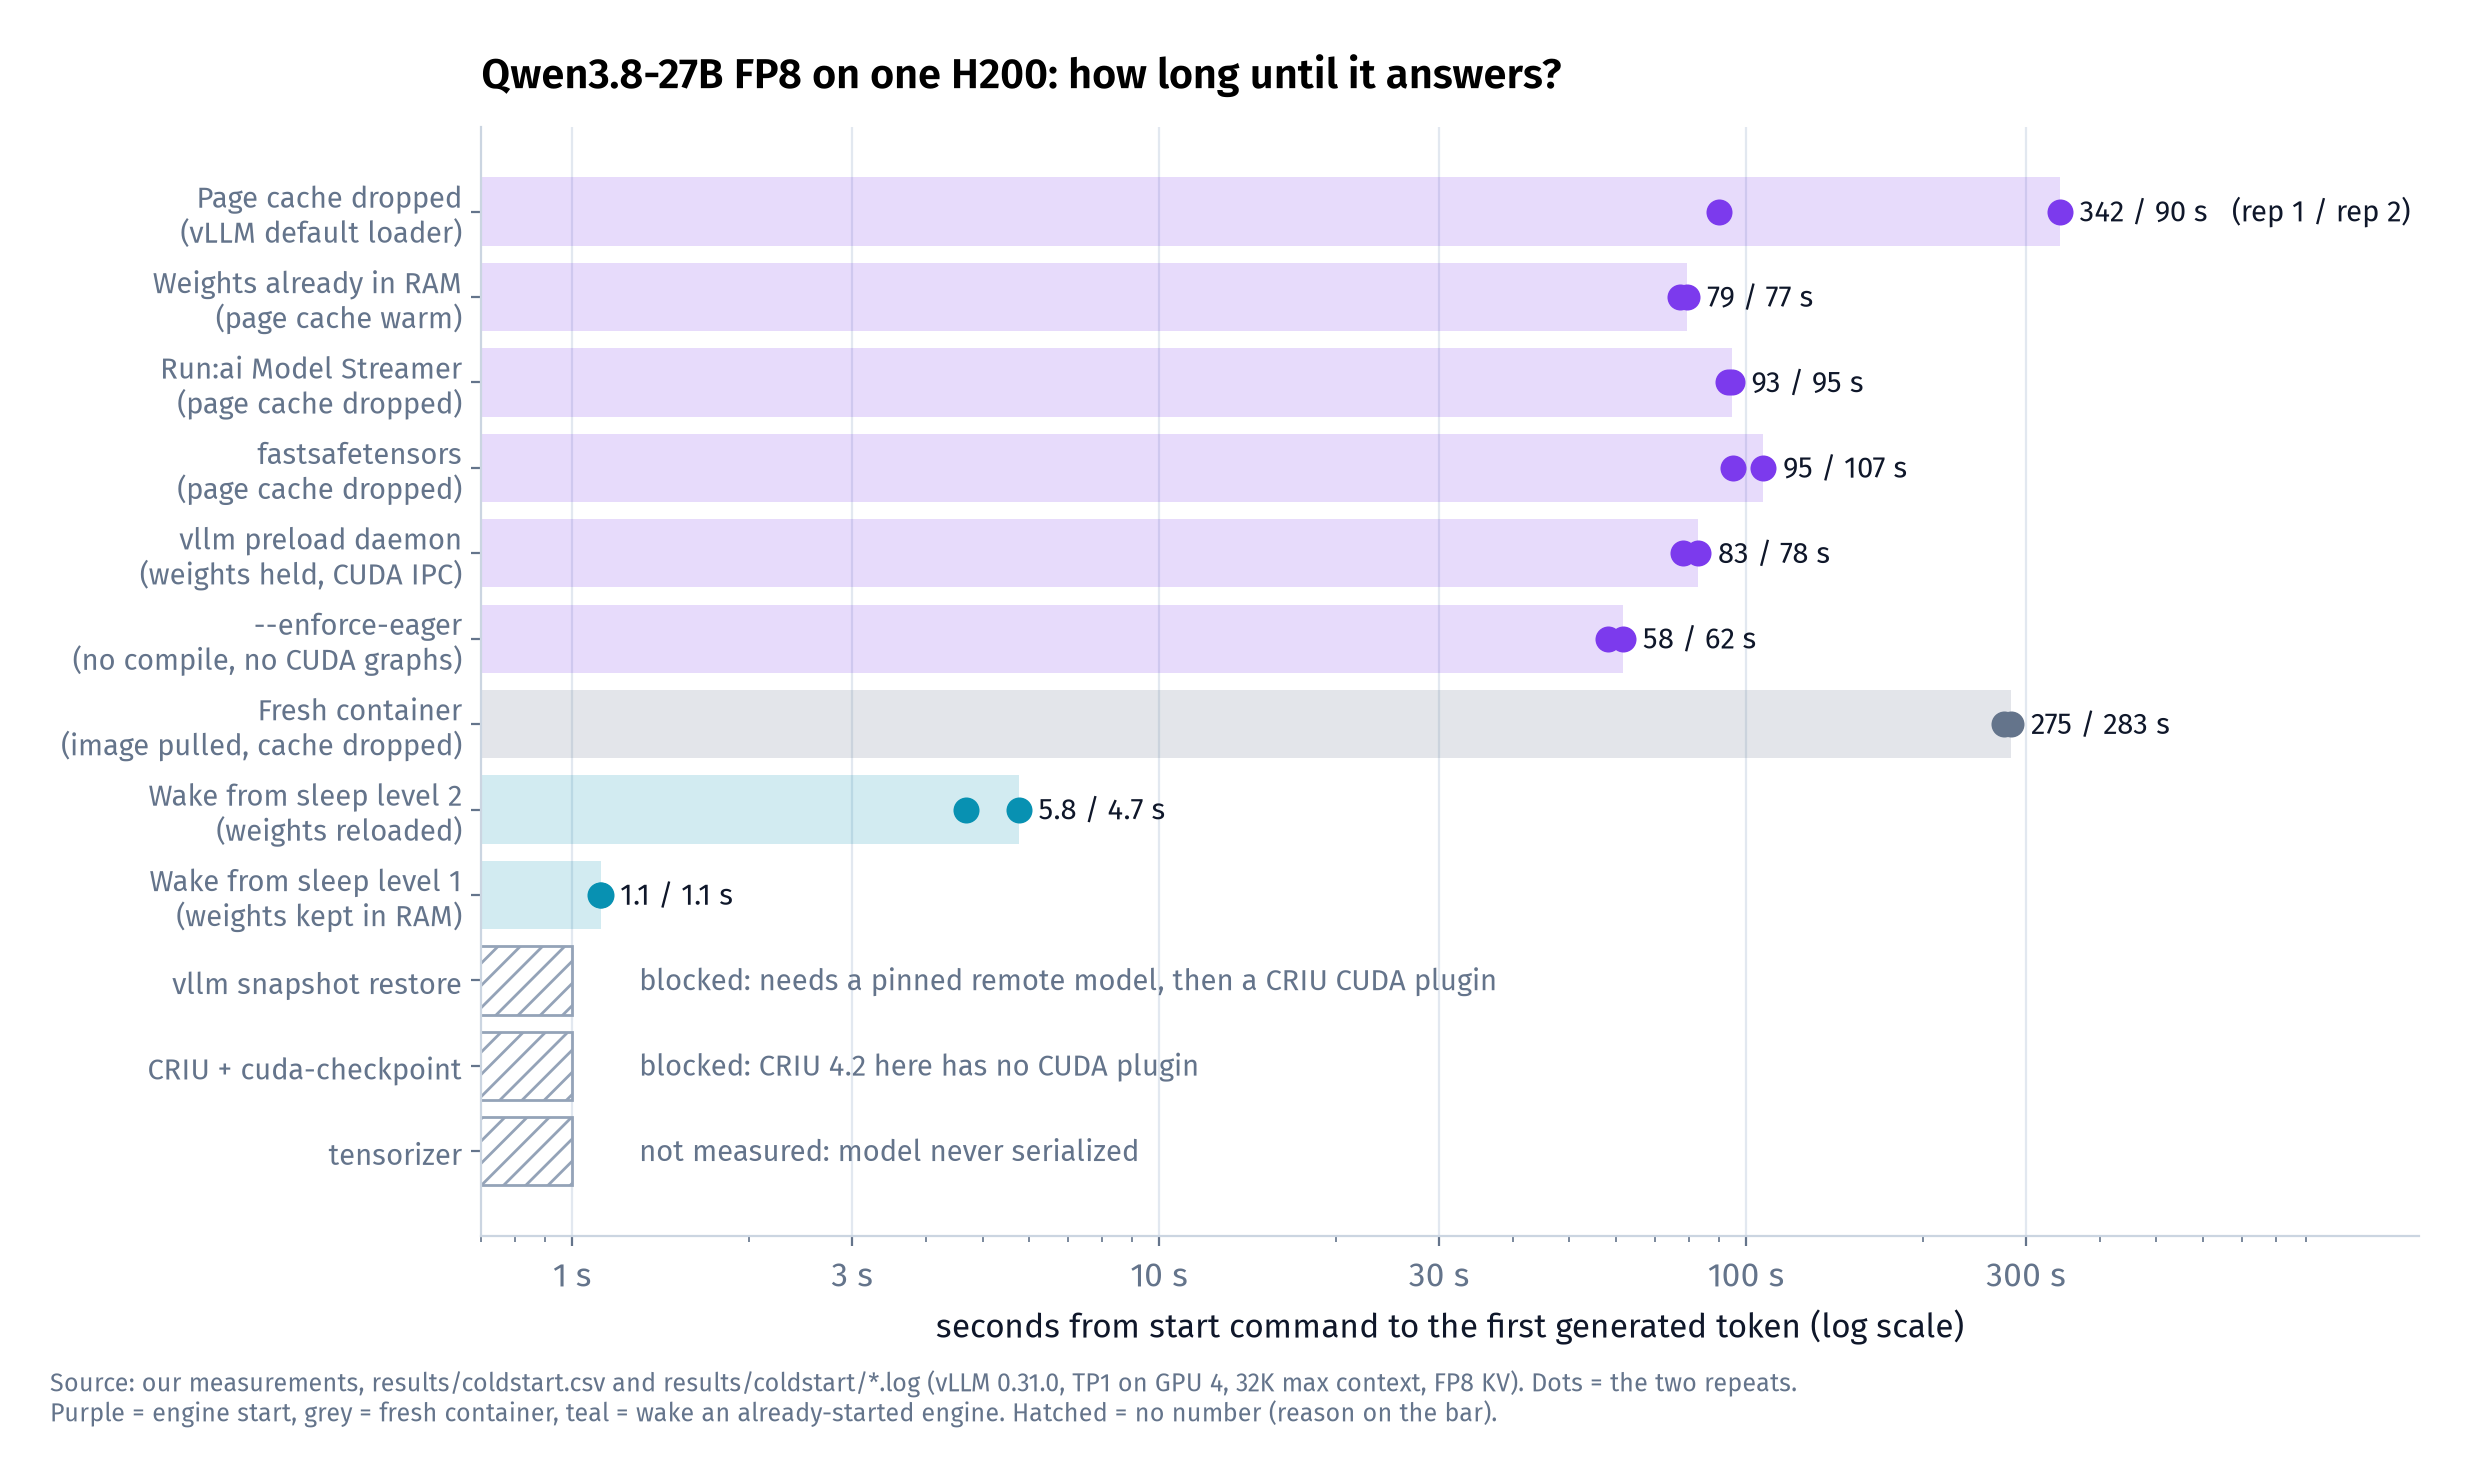
Our cold-start script (scripts/07_coldstart.sh) times one thing: wall seconds from the start command until a real completion token comes back (a curl loop polling every 0.2 s). It ran every mode twice on Qwen3.8-27B FP8, TP1, 32K max context. Two repeats is thin, so read the pairs, not a mean.
The first start is the expensive one, and it isn't the weights
The very first start took 342 s. The second page-cache-dropped start took 90 s, but the persistent compilation state was no longer cold. The server log explains the gap, and it's not disk:
$ grep -E "Loading weights took|torch.compile took|Graph capturing|init engine" results/coldstart/disk_cold_1.log   (trimmed)
Loading weights took 7.66 seconds
torch.compile took 37.74 s in total
Graph capturing finished in 85 secs, took 0.96 GiB
init engine (profile, create kv cache, warmup model) took 268.77 s (compilation: 37.74 s)
$ grep -E "Loading weights took|torch.compile took|init engine" results/coldstart/page_cache_warm_1.log
Loading weights took 3.02 seconds
Directly load AOT compilation from path /root/.cache/vllm/torch_compile_cache/torch_aot_compile/...
torch.compile took 0.32 s in total
init engine (profile, create kv cache, warmup model) took 35.90 s (compilation: 0.32 s)Reading 28.5 GiB of weights took 3 s from RAM and 8 s from the RAID (vLLM's own "Loading weights took" line). Everything else is engine start-up: compilation, the profiling run, CUDA-graph capture, KV allocation and the API server. That changes what's worth optimising:
- Keep the compile cache. It saved about 250 s on the first start. If
/root/.cache/vllmlives inside a throwaway container, every new container pays it again. Our "fresh container" mode (docker runof the stock image, page cache dropped, no cache volume mounted) took 275 s and 283 s, much nearer the very first start than the 77-90 s of a warm-cache start. We didn't keep that container's log, so the missing compile cache is the likely reason, not a measured one. - Faster loaders didn't help a 27B model. Run:ai Model Streamer (93 / 95 s) and fastsafetensors (95 / 107 s) were no faster than the default loader with the page cache dropped (90 s) or warm (79 / 77 s). Weight reading occupied only about 8 s of the measured default startup, leaving limited scope for a loader-only improvement in this experiment. On a model hundreds of GB in size it's different: one published 8× H200 DeepSeek-V4-Pro load went from 1,703 s with the default loader to 316 s with Run:ai streamer [S109] (their measurement, not ours).
- The
vllm preloaddaemon (weights held on the GPU by a separate process, engine attaches over CUDA IPC) took 83 / 78 s, again no better, because loading wasn't the slow part. --enforce-eager(no compile, no CUDA graphs) started fastest of the full starts, 58 / 62 s. That disables optimizations used during serving. We did not measure the corresponding decode tradeoff in this startup experiment, so the shorter launch time is not enough to choose eager mode.
A sleeping process avoids much of a restart
While asleep at level 1, GPU 4 retained about 2,061 MiB. Waking that 27B model took about a second, compared with more than a minute for the faster full starts. This was a warm process recovering its weights, not a fresh launch from an empty GPU and host. It requires enough free host RAM for the sleeping weights as well as the rest of the service; 2 TB installed is not the same as 2 TB available.
| Mode | Rep 1 | Rep 2 | What it costs |
|---|---|---|---|
| Wake from sleep level 1 | 1.12 s | 1.11 s | ~2 GB of HBM stays in use; the weights sit in host RAM |
| Wake from sleep level 2 + reload weights | 5.77 s | 4.69 s | weights reloaded from disk/page cache on wake |
| Full start, compile cache warm, weights in RAM | 79 s | 77 s | nothing held while stopped |
That's the number for anyone swapping several models on one GPU: about one second to bring a sleeping 27B model back versus more than a minute to start it. It only works if the host has free RAM for every sleeping model's weights, which a 2 TB node can provide when that memory is not already pinned elsewhere.
What we couldn't measure: snapshots
We wanted the third option, a CUDA checkpoint/restore of a fully started engine, so a cold start would become "restore a snapshot from disk". Both routes failed on this node, for reasons we could see:
# 1) vLLM 0.31.0's snapshot command, on our local weights directory
$ vllm snapshot create --snapshot-dir /mnt/data/snapshots/... /mnt/data/models/Qwen__Qwen3.8-27B-FP8 ...
ValueError: snapshot create requires an immutable remote model and 40-character --revision
# 1b) retry on 11 Oct: HF repo id + pinned 40-char revision, HF cache symlinked to our verified files (no download)
RuntimeError: CRIU_CUDA_PLUGIN_DIR is required
# 2) CRIU 4.2 + NVIDIA cuda-checkpoint 595.91.07 (installed to match the driver)
$ criu dump ...      (dump.log)
handle_device_vma plugin failed: No such file or directory
Can't handle non-regular mappingBoth stop at the same missing piece: the CRIU build on this node has no CUDA plugin, so GPU memory mappings can't be dumped. The vLLM retry followed the documented route for the snapshot command, which arrived for TP1 engines in vLLM PR #51360 (revision pins: #51446): a pinned remote model id and revision. It got one step further, to the same CRIU requirement. The pull request that would have shipped CRIU restore in vLLM's Docker image, #48996, was closed unmerged, so no upstream image we could find brings the CUDA plugin. Building CRIU with its CUDA plugin was more system surgery than the time left allowed, so we have no snapshot restore time. Two more things we learned for anyone trying: NVIDIA's cuda-checkpoint notes that checkpointing processes using CUDA IPC (which TP>1 does) needs a newer driver than our 595.91 [S110], so even a working setup here would have been TP1 only. And tensorizer was never measured because we didn't serialize the model first.
Conversation state: make the working set exceed HBM
This is where user concurrency decides everything. The test (scripts/08_multiturn.py) is a chat service under load: 32 sessions, each with its own ~100K-token history, 8 requests in flight at a time, six turns per session. Every turn adds about 2,400 tokens and asks for 400 output tokens. A barrier makes every session finish turn t before any starts t+1, so sessions are visited round-robin. The round-robin barrier deliberately stresses cache retention. It represents one access pattern, not the full distribution of arrivals in a live service.
The numbers that matter: 32 sessions × ~114K tokens = ~3.66M tokens of live context, against 2.92M tokens of KV cache on one H200 (the engine's own figure). The working set exceeded the pool by only about 1.3×. Under this access pattern, the reported zero hit rate was consistent with useful state being evicted before its next turn; it was not necessary to exceed capacity by an order of magnitude.
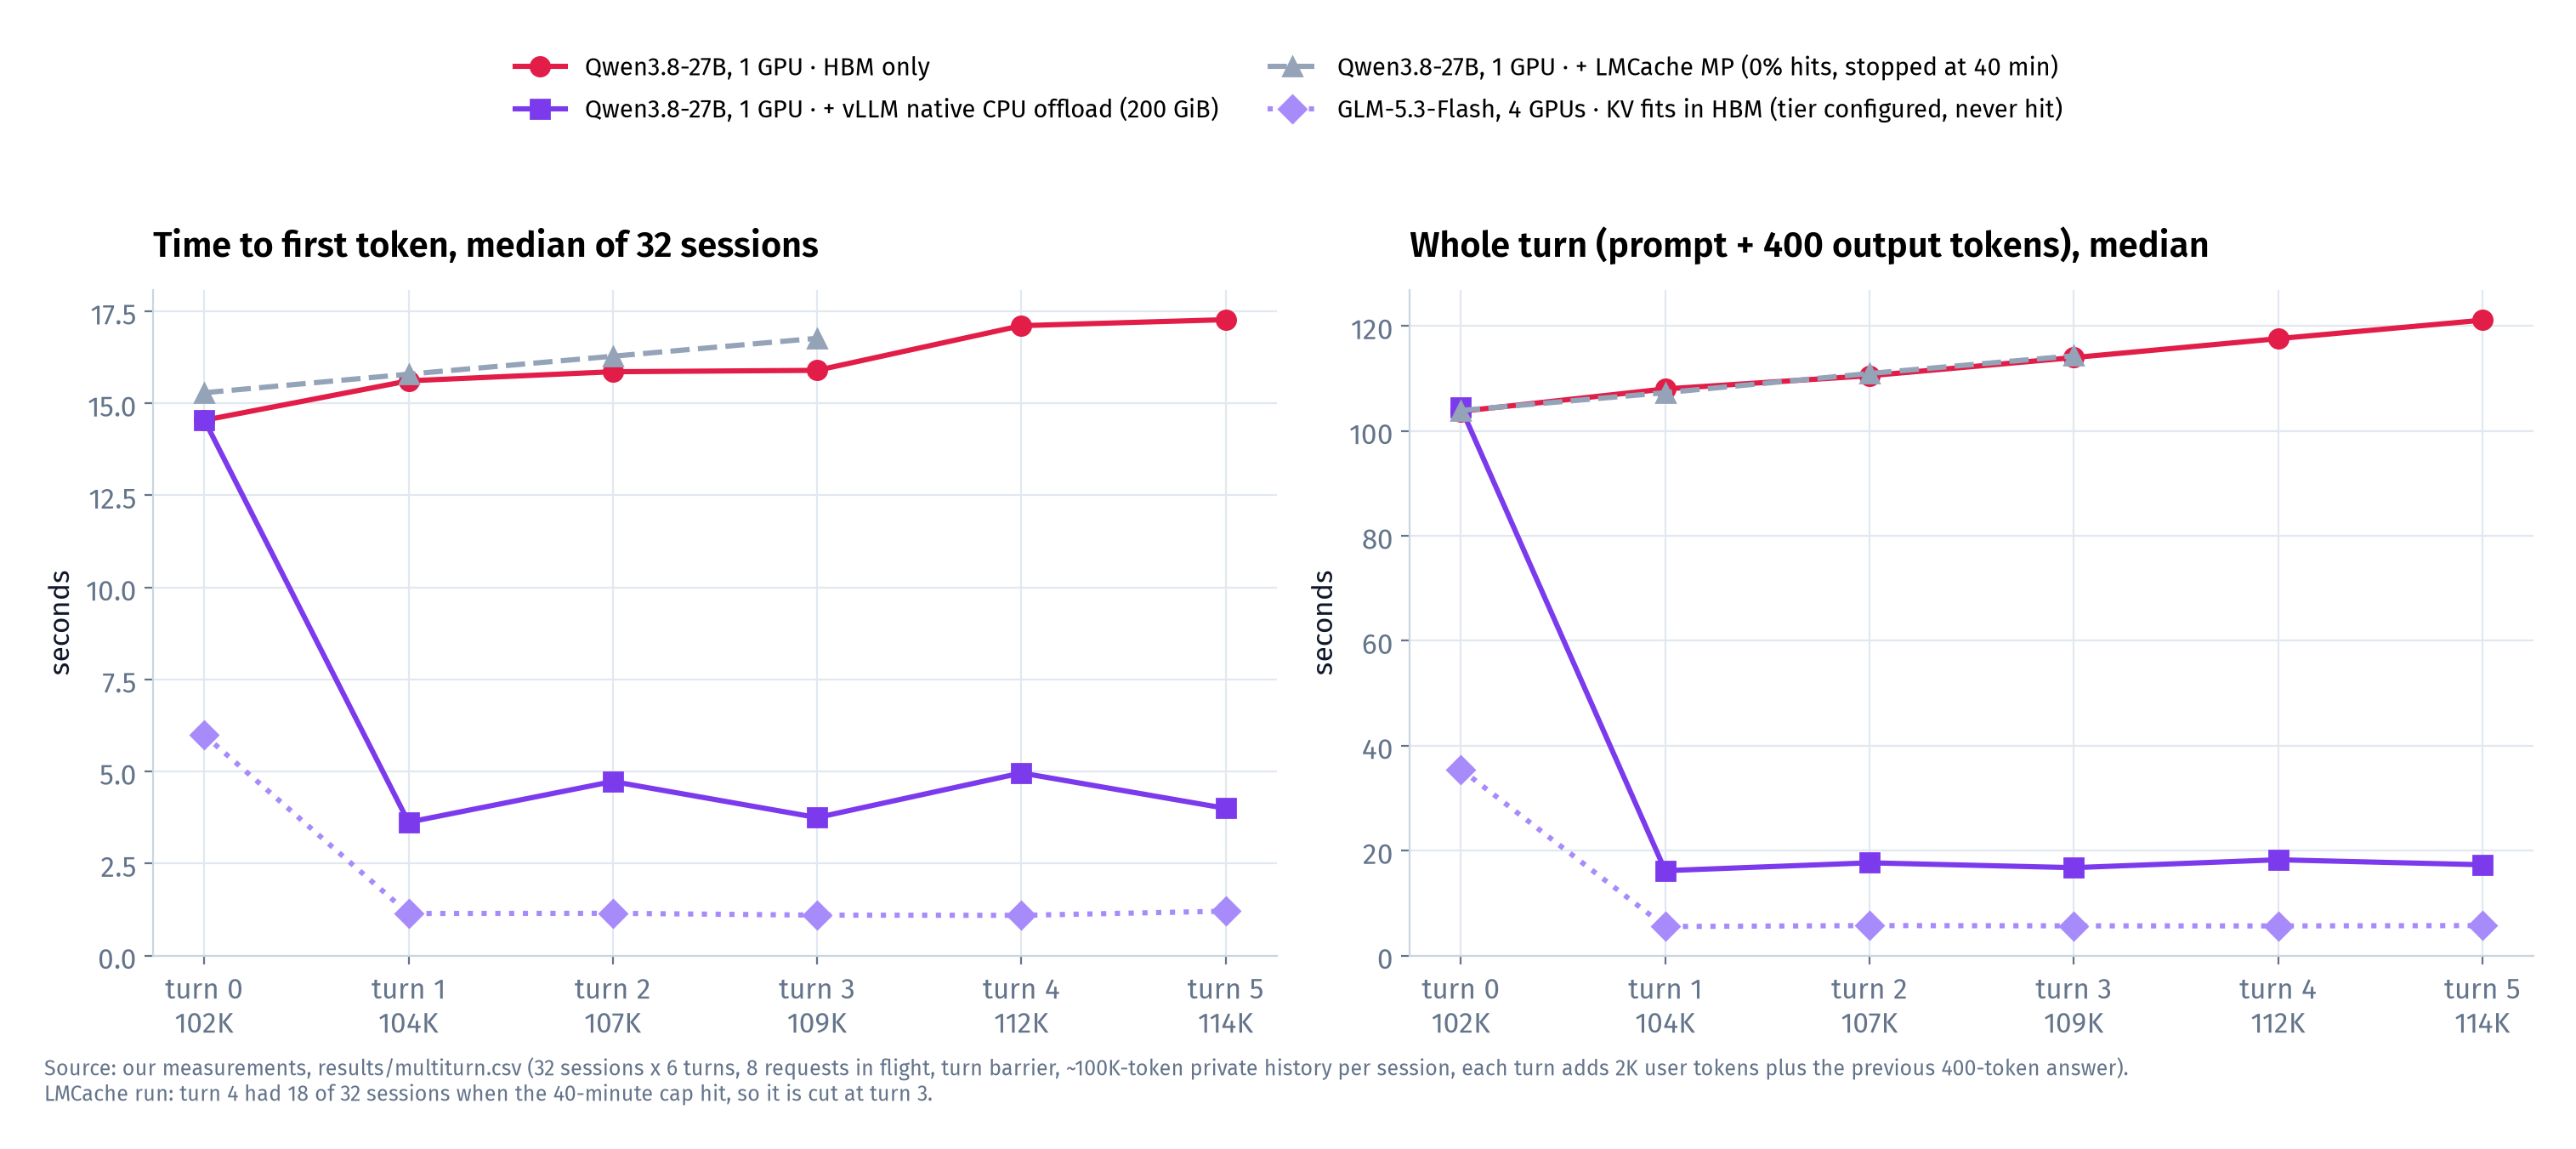
- HBM only: the GPU prefix cache reported 0.0% hits for the whole run. The reported zero hit rate indicates no measured prefix reuse for those requests. Median time to first token went up each turn, from 15.6 s at turn 1 to 17.3 s at turn 5, and a whole turn took 108-121 s.
- + native CPU offload (200 GiB): one extra flag pair,
--kv-offloading-backend native --kv-offloading-size 200. The server log reported external prefix cache hit rate 97.7%, and median TTFT on turns 1-5 was 3.6-5.0 s. A whole turn took 16-18 s instead of 108-121 s. The cost: about 70 s more start-up (ready in 332 s vs 262 s) to pin a 214.7 GB shared-memory region. - Quality check: offload paths have been reported to change model behaviour (an r/LocalLLaMA user saw Qwen3.8-27B "looping '!' after a couple of turns" with MTP + LMCache, r/LocalLLaMA thread). So we re-ran the offload server on 11 Oct (run 1011-022208) with a loop check: 24 multi-turn arithmetic questions over a shared long document. 24/24 correct, 0 looping. That's 24 answers on one model, not a broad accuracy study.
$ grep -o "External prefix cache hit rate: [0-9.]*%" results/runs/qwen38_27b__tp1_off_cpu_b__256k__vllm__1010-022810/server.log | tail -1
External prefix cache hit rate: 97.7%
$ grep -c "Prefix cache hit rate: 0.0%" results/runs/qwen38_27b__tp1_b__256k__vllm__1010-013827/server.log
272 # every logged interval of the HBM-only runIf many users each keep a long context, count total live context, not context per user. Here 32 users × ~110K tokens was only 1.3× one GPU's KV pool, yet without a tier below HBM the prefix cache did nothing. vLLM's native CPU offload on a host with spare RAM turned that into much shorter first-token waits on the measured later turns, with one flag pair. Size the pinned buffer to the RAM that's actually free (next section).
Three offload attempts that didn't give a number
LMCache. The LMCache image (lmcache/vllm-openai:v0.5.6rc3, vLLM 0.31.0 inside) crashed at start-up twice on 10 Oct, CPU and disk variants, with ValueError: Failed to promote local KV cache specs to one unified type. Qwen3.8-27B is a hybrid model (linear-attention layers plus full attention), and that connector couldn't unify its two KV layouts. On 11 Oct we tried LMCache's newer multi-process server instead. The first try failed on a chunk size (784 must be a multiple of the model's 1,568-token block), the second had a bad queue line, and the third (run 1011-033336) started and served traffic, but reported 0.0% external hits for the whole run, so its turns were no faster than HBM-only (chart above, grey). It hit its 40-minute cap during turn 4. We didn't find the cause in the time we had, so we report it as no gain, cause unknown, not as "LMCache doesn't work".
Native offload with --disable-hybrid-kv-cache-manager. A forum recipe for offload on hybrid models adds this flag r/LocalLLaMA 1rtggdo. On Qwen3.8-27B it crashes with the same "unified type" error, because the flag forces one KV layout and this model has two. vLLM 0.31.0 doesn't need it anyway: its offloading connector supports the hybrid manager (the issue behind that recipe, vLLM #41514, is closed), which is why our run without the flag worked.
gpt-oss-120b CPU offload. Four single-GPU copies, each asked to pin 400 GB of host RAM: 1.6 TB on a socket pair that also held a stale 400 GiB offload file left by an earlier run and a leftover 210 GB LMCache container. The kernel's OOM killer stepped in. That was run ..1011-042351 (09:53 IST Sunday): all four workers pinned their 400 GB, the kernel's OOM killer fired at 09:56 IST and took the 210 GB container first (kernel log, recorded in results/NOTES.md), and vLLM only reports Worker proc VllmWorker-0 died unexpectedly. An earlier launch at 08:31 IST had stopped before that, in the Rust frontend (Part 7). We deleted the stale file and prepared a 96 GiB-per-copy retry, but it was dropped for time. No gpt-oss-120b offload result. The lesson is the sizing: --kv-offloading-size is per engine, so multiply by the number of copies before you pick it.
The RAID tier: configured, never reached
To reach the NVMe tier we ran GLM-5.3-Flash on four GPUs with vLLM's tiering offload spec: 400 GiB of RAM, then a file-system tier on the RAID. Same 32-session workload. It was fast: median first token about 1.1 s on turns 1-5. But the log shows why, and it isn't the tier. Four GPUs hold 4.31M KV tokens, more than the 3.66M working set, so the GPU's own prefix cache served 97% of tokens and the external tier saw 0.0% hits in every logged interval. So the RAID tier is not measured. To measure it you'd need a working set larger than HBM plus the RAM tier, which on this node means many millions of tokens of live context. We didn't have a slot for that.
$ grep -o "Prefix cache hit rate: [0-9.]*%\|External prefix cache hit rate: [0-9.]*%" \
    results/runs/glm53_flash__r_kv_tier_tp4_b__256k__vllm__1011-024840/server.log | sort | uniq -c
     27 External prefix cache hit rate: 0.0%
     15 Prefix cache hit rate: 0.0%
      7 Prefix cache hit rate: 97.1%
5 Prefix cache hit rate: 97.0%What we'd do next time
- Persist
/root/.cache/vllm(compile cache) on a volume for every container. It was the biggest cold-start saving we measured. - Use sleep mode for multi-model GPUs if the host has RAM for the sleeping weights.
- Test native CPU offload when the live working set exceeds the engine’s KV pool and later turns would otherwise recompute useful state. Account for host-memory and transfer costs before enabling it. Size it per engine, from free RAM on that socket.
- Build CRIU with its CUDA plugin before the campaign if snapshot restore matters, and check the cuda-checkpoint driver requirement for TP>1.
The original startup CSV contains both repeats, including the 83/78 s preload starts and 58/62 s eager starts. Failed and skipped snapshot modes remain in that file instead of becoming zero-second results.
The next question was what the waiting cost
We had one measured host-memory win, a useful warm-process wake-up path, and no measured NVMe-tier or snapshot benefit. That distinction mattered when converting performance into money: a configured feature could not be assigned savings it had never demonstrated. Part 11 applies the same discipline to the bill.
Sources
Bracketed ids [S..] refer to the campaign bibliography (docs/SOURCES.md). Numbers not attributed to a source are our own measurements on this node.
- [S109] sc13912, https://github.com/sc13912/dsv4p-p5en-gds-fsxl
- [S110] NVIDIA, https://github.com/NVIDIA/cuda-checkpoint
- [S53] vLLM project (docs), https://docs.vllm.ai/en/stable/features/kv_offloading_usage/
- vLLM project, https://docs.vllm.ai/en/latest/features/sleep_mode.html (vLLM docs: Sleep Mode)
- vLLM project, https://github.com/vllm-project/vllm/pull/51360 (vLLM PR #51360)
- vLLM project, https://github.com/vllm-project/vllm/pull/51446 (#51446)
- vLLM project, https://github.com/vllm-project/vllm/pull/48996 (#48996)
- u/rmhubbert, Aug 2026, https://www.reddit.com/r/LocalLLaMA/comments/1vtjpe7/ (r/LocalLLaMA thread)
- u/Rascazzione, Mar 2026, https://www.reddit.com/r/LocalLLaMA/comments/1rtggdo/ (r/LocalLLaMA 1rtggdo)
- vLLM project, https://github.com/vllm-project/vllm/issues/41514 (vLLM #41514)